01The DevOps problem
Developers needed a clearer answer about their services.
A digital product is made up of services: individual parts that do jobs such as signing someone in or processing a checkout. DevOps teams help build, run and keep those services reliable. They use metrics, or measurements of activity and performance, to understand what is happening.
For services created natively in DevPortal, Intuit already supplied Base Metrics. When developers needed a more granular answer, they could build queries on top of a Base Metric, adding filters and calculations. The result is a Custom Metric.
An everyday example · checkout
How many requests is the service receiving?
A starting view of service activity.
How many checkout requests failed in one region?
A query narrows the Base Metric to the data relevant to that question.
Illustrative example to explain the concept. Selected views below illustrate the workflow with example data.
DevPortal did not yet support that creation journey. Developers used Grafana or Wavefront, or wrote PromQL, a query language, in YAML configuration files. In the configuration route, feedback arrived after the changes were applied. Developers unfamiliar with PromQL sometimes skipped Custom Metrics setup and published service data to Wavefront instead.
Many DevOps engineers were already comfortable with Grafana and Wavefront. The challenge was to give them a compelling native experience without asking them to relearn familiar work, while making the capability more approachable for those who needed guidance.
02Learning the domain
Before designing for engineers, I learned how they worked.
I joined without prior knowledge of the domain or product. I spent several weeks learning how developers worked, why services needed Base Metrics and Custom Metrics, and how the existing tools supported that work. Building this understanding was essential to designing a credible DevOps experience.
I started with the brief from Product and Engineering and the foundational interviews conducted by Product. I worked through the current journey, clarified dependencies with the team and translated technical requirements into decisions a user would need to make.
Understand the intent
What question is the engineer trying to answer? Where do Base Metrics stop being sufficient?
Learn the mental model
How do they select data, refine a query and judge its result in the tools they already know?
Follow the lifecycle
How will they find, create, inspect, edit and promote a Custom Metric after the first session?
My responsibility covered experience and interaction design, prototypes, usability testing, refinements and handoff. Product and Engineering shaped priorities and feasibility; design leadership and the wider team collaborated on direction and review.
03What users needed
Familiarity became the adoption strategy.
We needed more than another query editor. The experience had to address workflow fragmentation, the knowledge required to get started and the delay between making a choice and understanding its effect.
Familiarity and continuity
DevOps engineers already knew Grafana and Wavefront, but Custom Metrics creation was missing from DevPortal.
Design implicationRetain familiar query-building patterns and connect them to native service context and management.
Recognition over recall
Engineers unfamiliar with PromQL sometimes skipped Custom Metrics setup.
Design implicationExpose Base Metrics, Operators and Labels as visible choices, alongside Build with Code.
Feedback before commitment
In the configuration-file route, problems surfaced after the setup was applied.
Design implicationKeep Run query and the interactive graph inside the creation task.
I used familiar building blocks: Base Metrics, Operators, Labels, a code editor and a graph preview. That reduced the amount of new vocabulary engineers needed to learn. Native integration then added the value: the engineer could work within the service’s context and manage the Custom Metric where the rest of that service already lived.
I initially considered users with different levels of PromQL familiarity. Testing later showed why that should inform coverage without turning into a rigid novice-versus-expert split: experienced users also valued the Visual Query Builder.
04Customer journey
A complete lifecycle, from first query to recovery.
The journey begins with a question the Base Metrics cannot answer on their own. It ends with a Custom Metric the team can find, understand and maintain. I mapped the entire lifecycle to connect creation decisions to later use.
Customer journey · from a service question to a useful Custom Metric
Open full diagram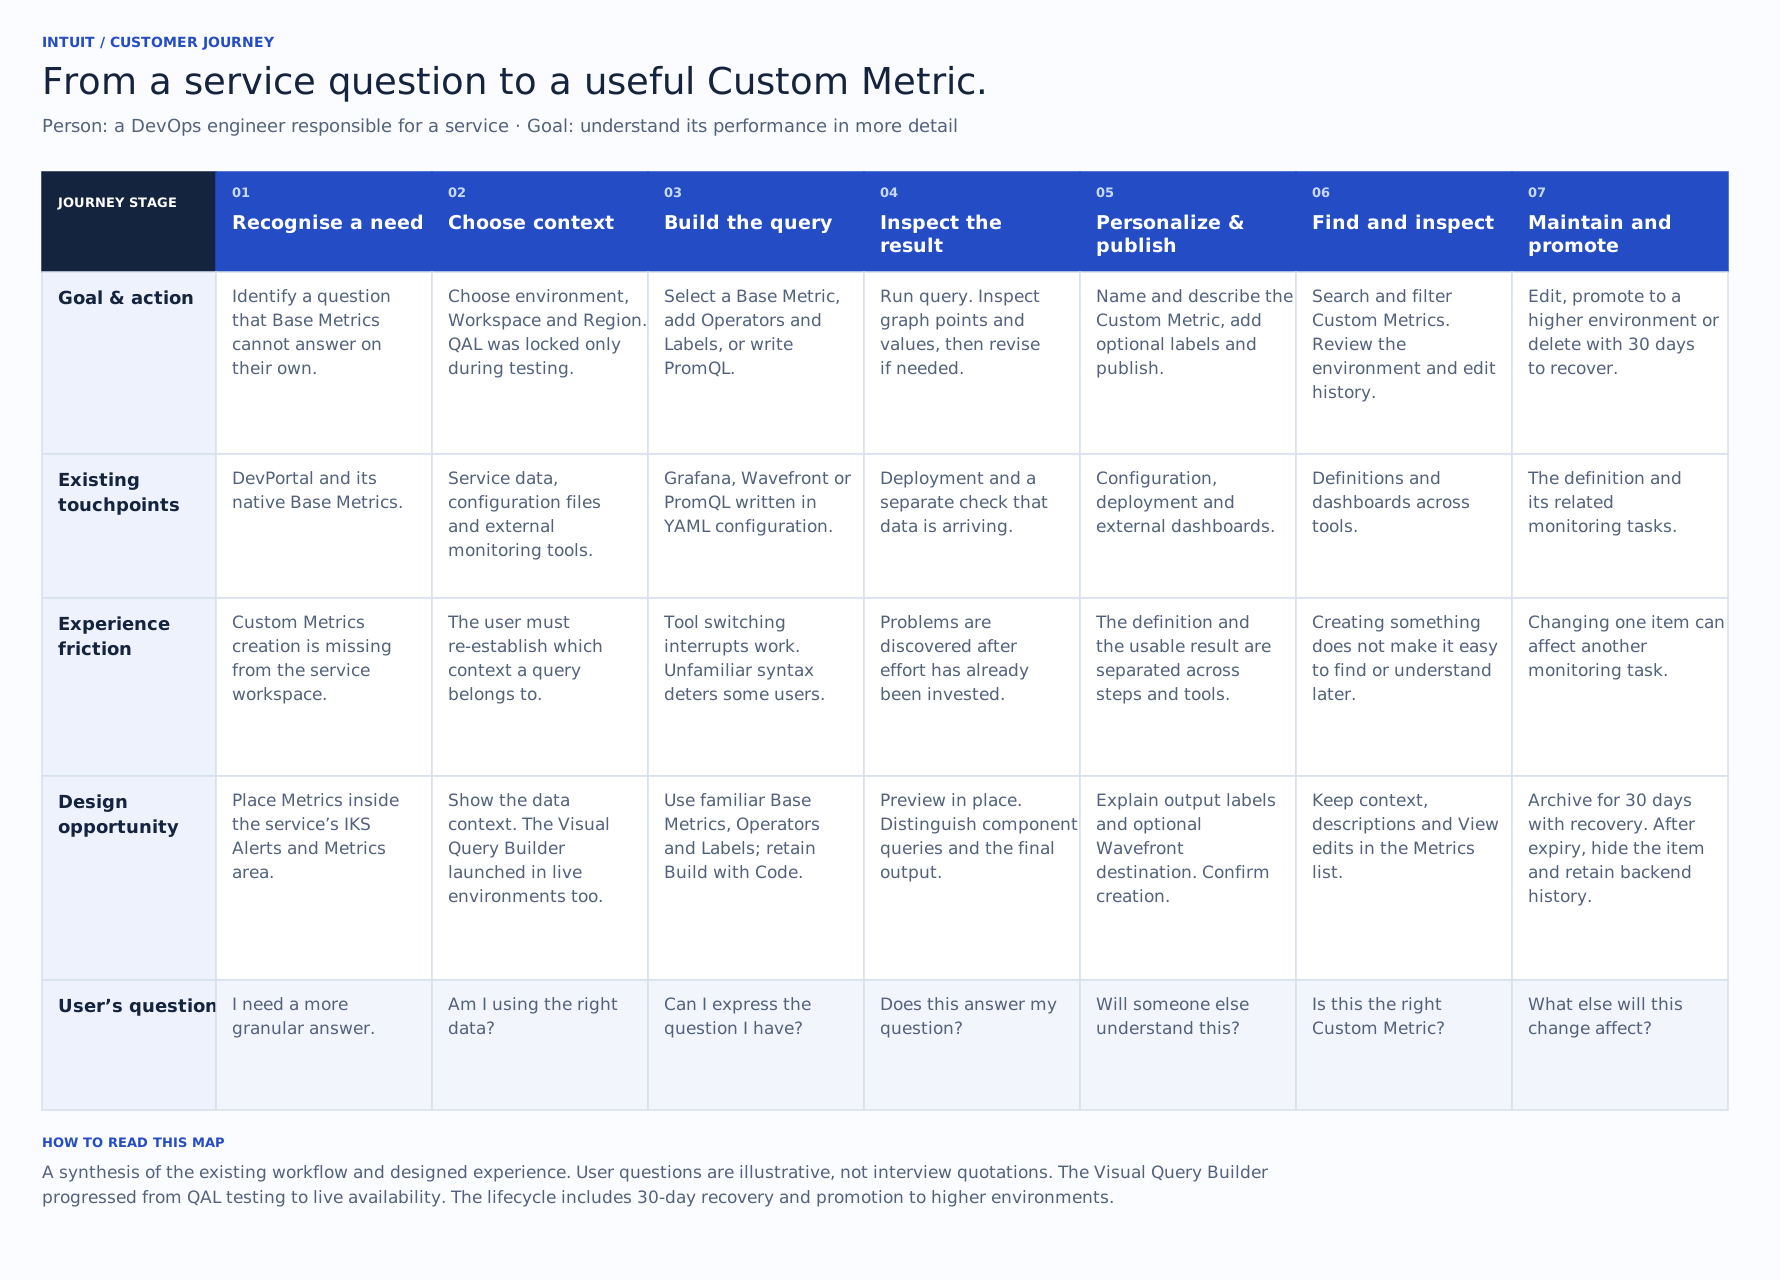
Read the journey as text
Recognise a need
- Goal
- Answer a question about a service that Base Metrics cannot answer on their own.
- Existing difficulty
- The relevant capability is missing from the service workspace.
- Design response
- Place Metrics under IKS Alerts and Metrics, with a clear creation entry point.
Choose context
- Goal
- Use the right service data.
- Existing difficulty
- The engineer must remember which context a query belongs to.
- Design response
- Keep service context visible before query construction.
Build the query
- Goal
- Create a Custom Metric that answers the question.
- Existing difficulty
- Tool switching interrupts the flow; unfamiliar syntax deters some users.
- Design response
- Support familiar code and visual routes in DevPortal; allow one nested group in the first visual scope.
Inspect the result
- Goal
- Understand what the query returns before publishing.
- Existing difficulty
- Feedback arrives after effort has been invested.
- Design response
- Preview in place; distinguish component queries from the final output.
Personalize and publish
- Goal
- Make the Custom Metric recognisable and useful to the team.
- Existing difficulty
- Defining the query and making it usable are disconnected.
- Design response
- Explain output labels and the optional Wavefront destination; confirm creation.
Find and inspect
- Goal
- Return to an existing Custom Metric with confidence.
- Existing difficulty
- Creation does not guarantee later discoverability.
- Design response
- Keep Workspace, Region, descriptions and View edits in the Metrics list.
Maintain and promote
- Goal
- Keep the Custom Metric relevant as the service changes.
- Existing difficulty
- Changes can affect monitoring and related alerts.
- Design response
- Keep lifecycle actions close to their target. Archive deleted Custom Metrics for 30 days so they can be restored; retain history in the backend after removal from the user’s view.
A home for the whole Custom Metrics lifecycle.
I introduced Metrics within the service’s IKS Alerts and Metrics area, labelled “IKS AIR metrics & alerts” in the interface. The landing page supports discovery and CRUD (create, read, update and delete), alongside edit history and promotion from a lower to a higher environment.
Error prevention and recovery were part of the lifecycle. Management needed to support changing needs and give engineers control when they made a mistake. Delete used a 30-day recovery window: a deleted Custom Metric was archived and could be restored during that period. After 30 days, it was removed from the user’s view while its history remained in the backend. Promote made the Custom Metric available in a higher environment, where engineers could work with more data points.
Restore a Custom Metric before its recovery window ends.
| Metric name | Environment | Deletion time | Action |
|---|---|---|---|
| Checkout request rate | QAL | In 25 days |
Restore Metric?
Restoring this Custom Metric will make it available again. Do you want to continue?
| Metric name | Environment | Workspace | Region | Edit history | Actions |
|---|---|---|---|---|---|
| Checkout request rate | QAL | Payments | USW2 | View edits | ••• |
| Service memory usage | PRD | Payments | USW2 | View edits | ••• |
| Active connections | PRD | Payments | USW2 | View edits | ••• |
| Checkout error rate | PRD | Payments | USW2 | View edits | ••• |
Search, context and lifecycle actions stay close to the Custom Metric.
The row actions keep routine management near the relevant Custom Metric. Edit history gives a returning engineer context about changes. This matters because a successfully created query is only useful if someone can confidently return to it later.
Explore the management journey05Design decisions
A familiar workflow, connected from setup to publish.
Interactive journeys
Experience the solution, one journey at a time.
Build and preview a Custom Metric, combine queries or recover a deletion. Selected interface views and interactive journeys use illustrative data to explain the experience.
1. Establish the right context.
Creation starts with the service’s workload. During testing, the environment is locked to QAL; the user selects a Workspace and Region, US West or US East. The Visual Query Builder subsequently launched in the live environment, after the initial code-first MVP. The QAL lock was a testing constraint. Establishing the environment, Workspace and Region first makes it clear which data the query will address. Progressive disclosure keeps the sequence focused: establish context, build and inspect the query, then add the details needed to recognise and reuse it.
2. Build on a Base Metric, with the right level of control.
PromQL expression
sum by (cluster) (rate(demo_http_requests_total{env="qal", region="usw2"}[5m]))- BASE METRIC
Start with available data
Visible options help engineers discover a relevant Base Metric without remembering its exact name.
- OPERATORS & LABELS
Refine the question
Operators calculate or aggregate; Labels narrow the relevant data. The generated expression makes the effect of those choices inspectable.
- RUN QUERY
Check before committing
Run the query in place, then hover over the graph to inspect data points and values. Revise the parameters without leaving DevPortal.
- BUILD WITH CODE
Keep a direct route
Engineers comfortable with PromQL can write queries directly, including expressions beyond the visual route’s nesting limit.
See Build with Code, the route launched first
The code route brought the existing PromQL workflow into DevPortal with context selection and an immediate graph preview. It reduced tool switching for experienced users while the Visual Query Builder addressed the additional barrier of constructing queries.
sum by (cluster) (
  rate(demo_http_requests_total{
    env="qal", workspace="payments", region="usw2"
  }[5m])
)3. Combine queries when one is not enough.
“Add more query” lets an engineer build another component query, such as Query B alongside Query A. Nesting connects those components into one expression for the final Custom Metric. The first visual release was scoped to one nested query group, a deliberate boundary agreed with Product and Engineering so the capability could scale gradually.
That limit applies to the visual interaction. Build with Code provides a route for DevOps experts who need more complex nesting. The UX challenge is making the relationship between the components and the final output understandable before the user publishes.
See how component queries connect
PromQL expression
sum by (cluster) (rate(demo_http_requests_total{env="qal", region="usw2"}[5m]))4. Make the result recognisable, then publish.
After inspecting the preview, the engineer gives the Custom Metric a name and description. Additional custom labels identify the resulting Custom Metric; these are different from the query Labels used to filter a Base Metric. Contextual help explains the default workspace and region labels.
Personalize your Custom Metric
Custom Labels
Identify the resulting metric, without changing its query filters.
+ Add custom label
□ Send Custom Metric data to Wavefront
The optional “Send custom metric data to Wavefront” control is important: the goal was to bring creation and management into DevPortal. It did not require removing every external destination for the resulting data.
User flow · create, inspect, publish and return
Open full diagram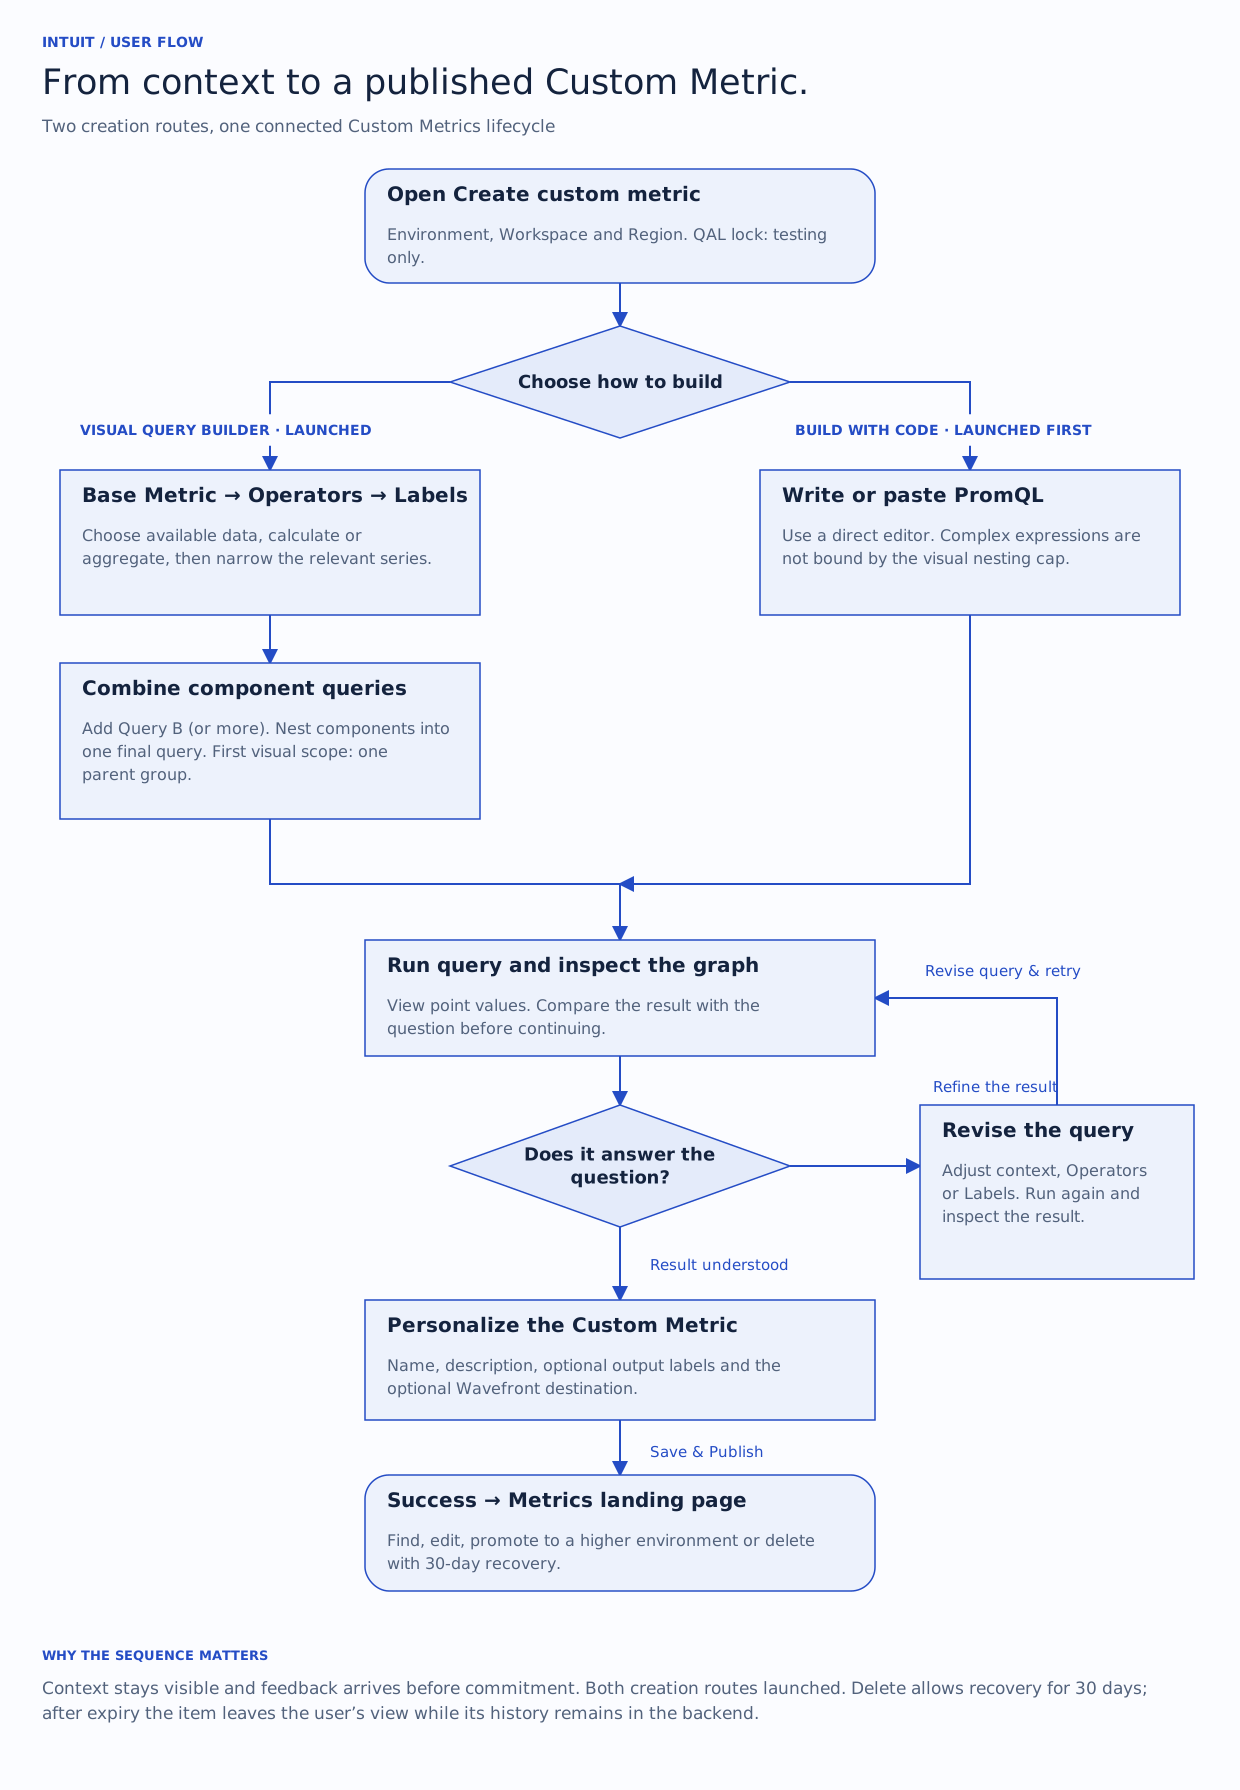
06Scope & trade-offs
When feasibility changed, I protected the core task.
The delivery direction changed during the project. We began with a native DevPortal experience, were asked to explore embedding Grafana and completed that direction within a week. Engineering’s feasibility review then ruled it out. I returned to the native journey with a narrower first-release scope.
The first release
Bring Build with Code into DevPortal.
Serve engineers already comfortable with PromQL, with context, editing and preview in one workspace.
The next launched capability
Make creation accessible without writing PromQL.
The Visual Query Builder exposes Base Metrics, Operators and Labels as choices and supports guided construction.
Once scope stabilised, we delivered the code-editor designs within two weeks. Build with Code launched first; the Visual Query Builder followed and became available in the live environment after testing. I preserved the core task through those changes: establish context, build the Custom Metric, inspect its result and manage it in DevPortal.
There was a second scope boundary in the Visual Query Builder: one nested group for the first release. That constrained the interaction we needed to support immediately, while the code route retained greater expressive flexibility. It was a scope decision to communicate clearly, not a reason to hide a limit until the user encountered an error.
07Testing & refinements
Testing changed my assumptions about expertise.
I tested the experience with nine participants through moderated and unmoderated sessions, including in-person and remote testing. Different levels of PromQL familiarity helped us examine both the effort of getting started and control over more involved tasks.
“Super convenient to have the metric builder built into the devportal.”
Usability participant · session feedbackThe value was completing the task in the workspace they already used.
Finding 01 · flexibility
Experienced engineers also valued the visual route.
Seeing available functions, Operators and Labels reduced recall and effort, even for someone capable of writing PromQL.
Design responseOffer both routes around the task, without permanently assigning users to a novice or expert mode.
Finding 02 · comprehension
Visible controls still needed explanation.
Less-familiar participants needed help with custom labels and knowing how to begin.
Design responseAdd contextual tooltips. Further onboarding, including videos or guided tours, was planned for the fuller experience.
Finding 03 · familiarity
The code route needed established editor behaviour.
Participants expected copy and paste, syntax colour and clear errors. Feedback also requested formatting support.
Design responseUse familiar editor conventions and take the specific interaction feedback into refinement with Engineering.
Finding 04 · relationships
Nesting was harder to understand than adding a query.
A participant struggled with the representation of a multi-part query in the Visual Query Builder.
Refinement directionMake the relationship between component queries and the final output more explicit. This informed my reflection on how to evolve the interaction.
Trace the findings to the design decisions
Research to design · observation, interpretation and response
Open full diagram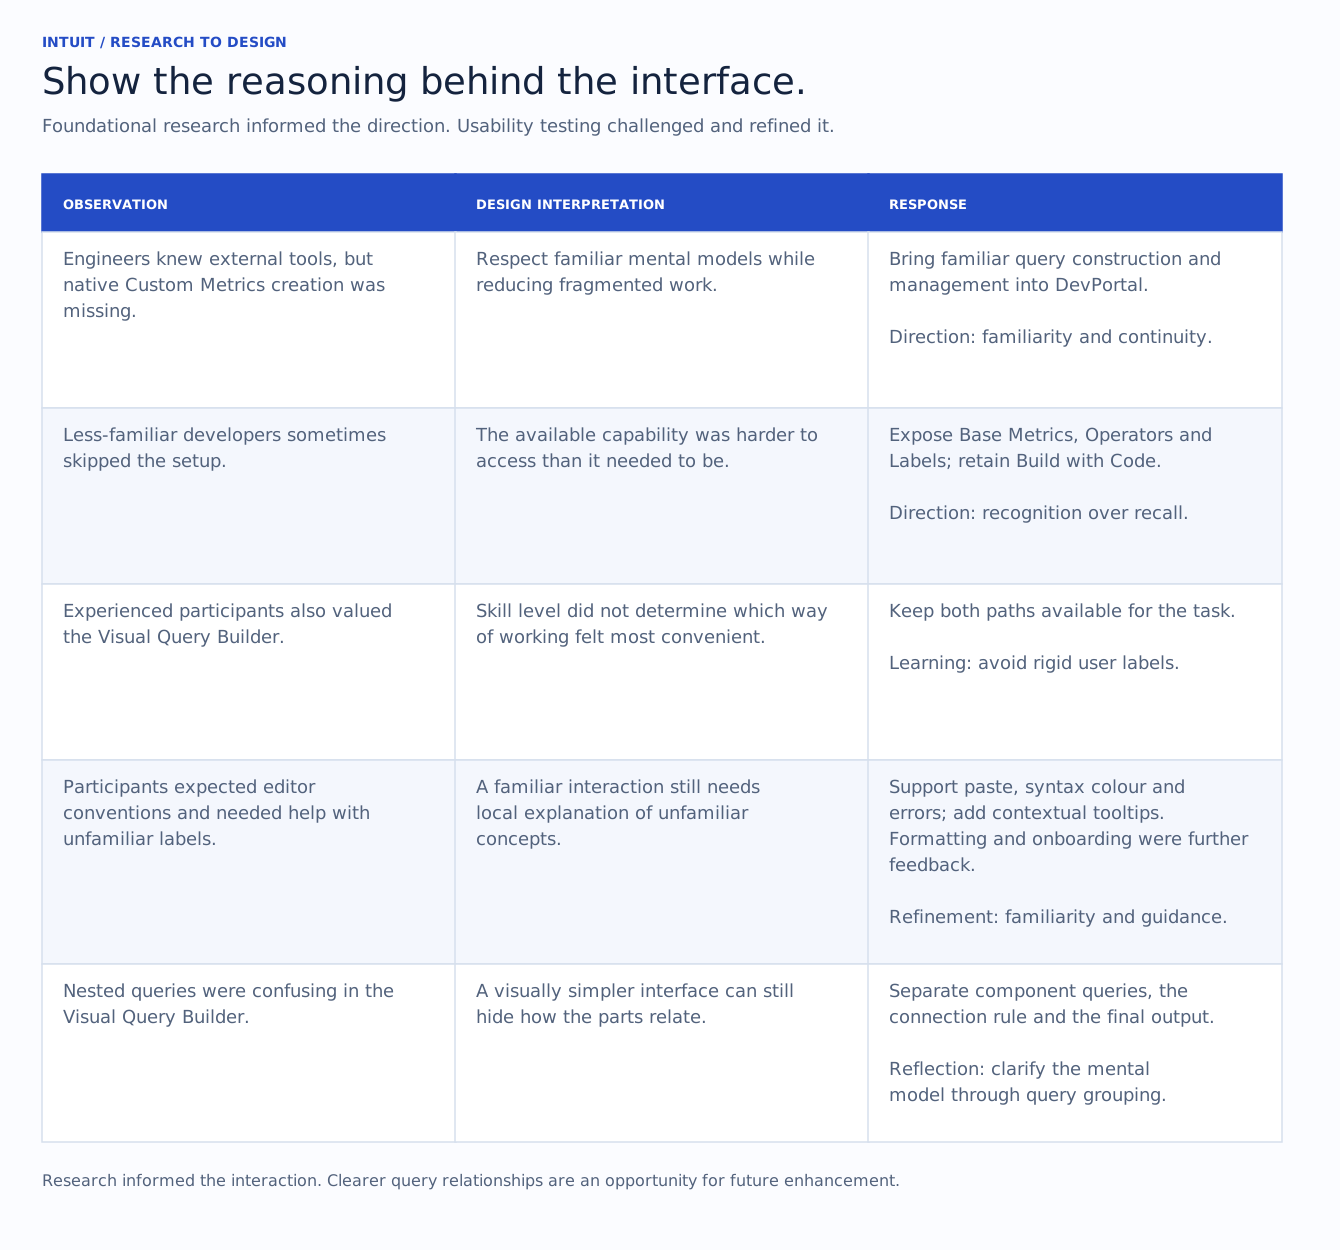
08Delivery & impact
From code-first adoption to a live visual workflow.
Build with Code
Custom Metrics creation moved into DevPortal for engineers comfortable with PromQL.
The Visual Query Builder
The guided route progressed from QAL testing to availability in the live environment, making Base Metrics, Operators and Labels visible choices.
Manage, recover and promote
Engineers could maintain Custom Metrics, recover a deletion within 30 days and promote a metric to a higher environment for more data points.
What the code-first MVP demonstrated.
Pilot adoption
Share of the pilot group actively using DevPortal to create Custom Metrics after the code-first MVP.
Lower incident-resolution time
Average incident-resolution time compared with the programme’s existing mean time to resolution (MTTR) baseline.
The pilot included DevOps engineers and managers across QuickBooks, Credit Karma, Mailchimp and other business streams. These measures reflect the code-first MVP: 60% of the pilot group actively adopted creation in DevPortal. The MTTR improvement was a shared programme outcome across design, engineering and operations.
The study recorded an average creation time of approximately 5 minutes 23 seconds. This provides a task-completion benchmark for the tested journey, rather than a before-and-after speed claim.
The work established native Custom Metrics creation and management, with both routes ultimately available in the live product. It gave Intuit ownership of the experience and a foundation for reducing dependence on external creation workflows. The adoption and MTTR figures above are the measured outcomes; they do not represent quantified external-tool savings.
09What I learned
Clarity is how I design for complex domains.
I entered the project without DevOps expertise and learned enough to structure the work, ask better questions and make informed interaction decisions. The same discipline applies across enterprise products: understand the domain deeply, then introduce its complexity at the moment the user needs it.
Familiarity did not mean copying another platform wholesale. It meant respecting the engineer’s mental model while using native context to reduce effort. And simplification did not mean removing control; the visual and code routes gave users different ways to reach the same goal.
Design around the task, not a fixed level of expertise.
Experienced engineers also preferred visual controls for some tasks. That reinforced the value of flexible routes. Contextual guidance, short walkthroughs and clearer custom-label explanations are opportunities to build on that flexibility.
Make relationships as legible as individual controls.
The nesting feedback showed that adding a second query and understanding its relationship to the final output are different cognitive tasks. Clearer grouping and a stronger distinction between component queries and the combined result would help the experience evolve as query complexity grows.
Protect the user’s goal when the delivery route changes.
Moving from native design to a Grafana exploration and back required quick alignment with Product and Engineering. Phased delivery kept the goal intact: create, inspect and maintain a useful Custom Metric without leaving the service workspace.
Two creation routes. One service workspace. A launched experience that made Custom Metrics easier to create, inspect and maintain.